Precision:
Click or drag file here
PNG, JPG, GIF, WEBP
Chart data extraction accuracy — seed 42
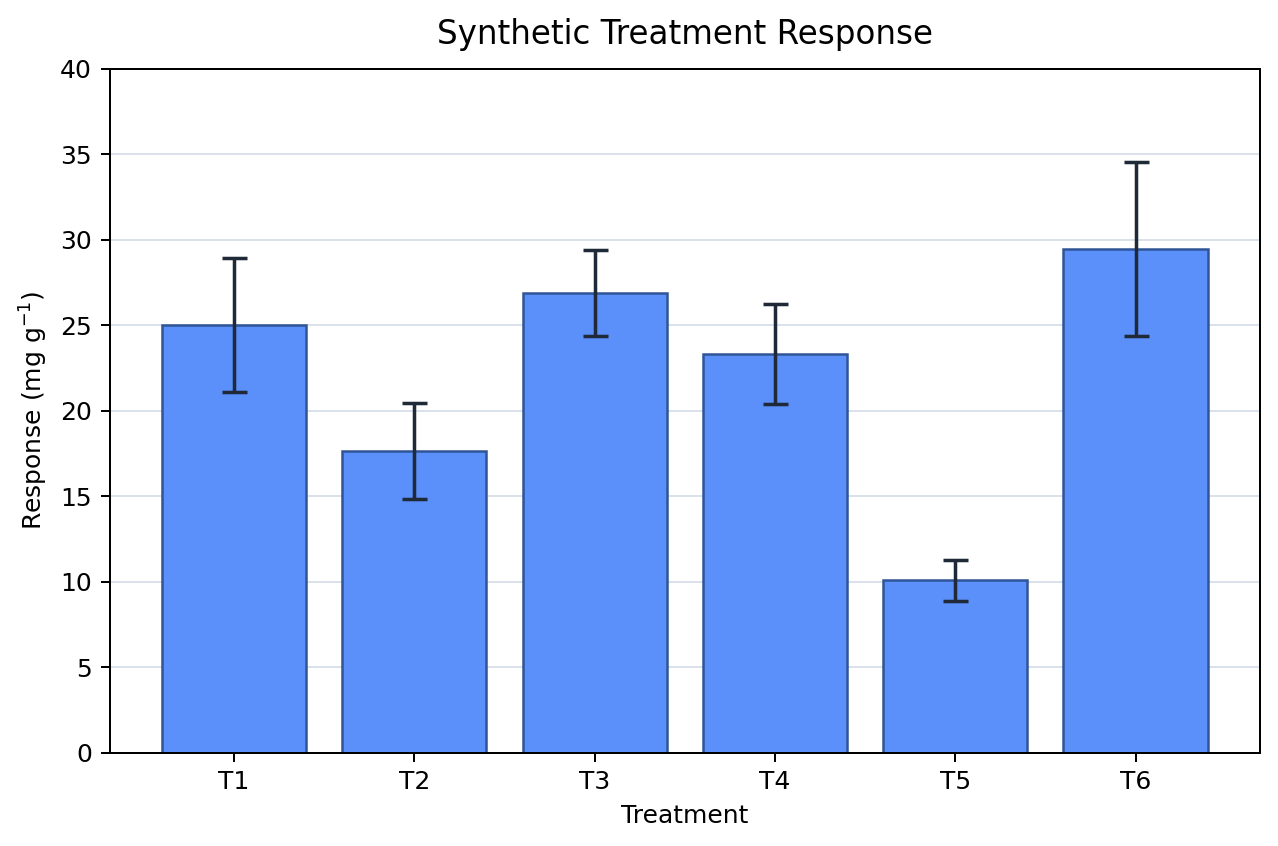
Test Chart 1 — Bar with Error Bars
(Synthetic Treatment Response)
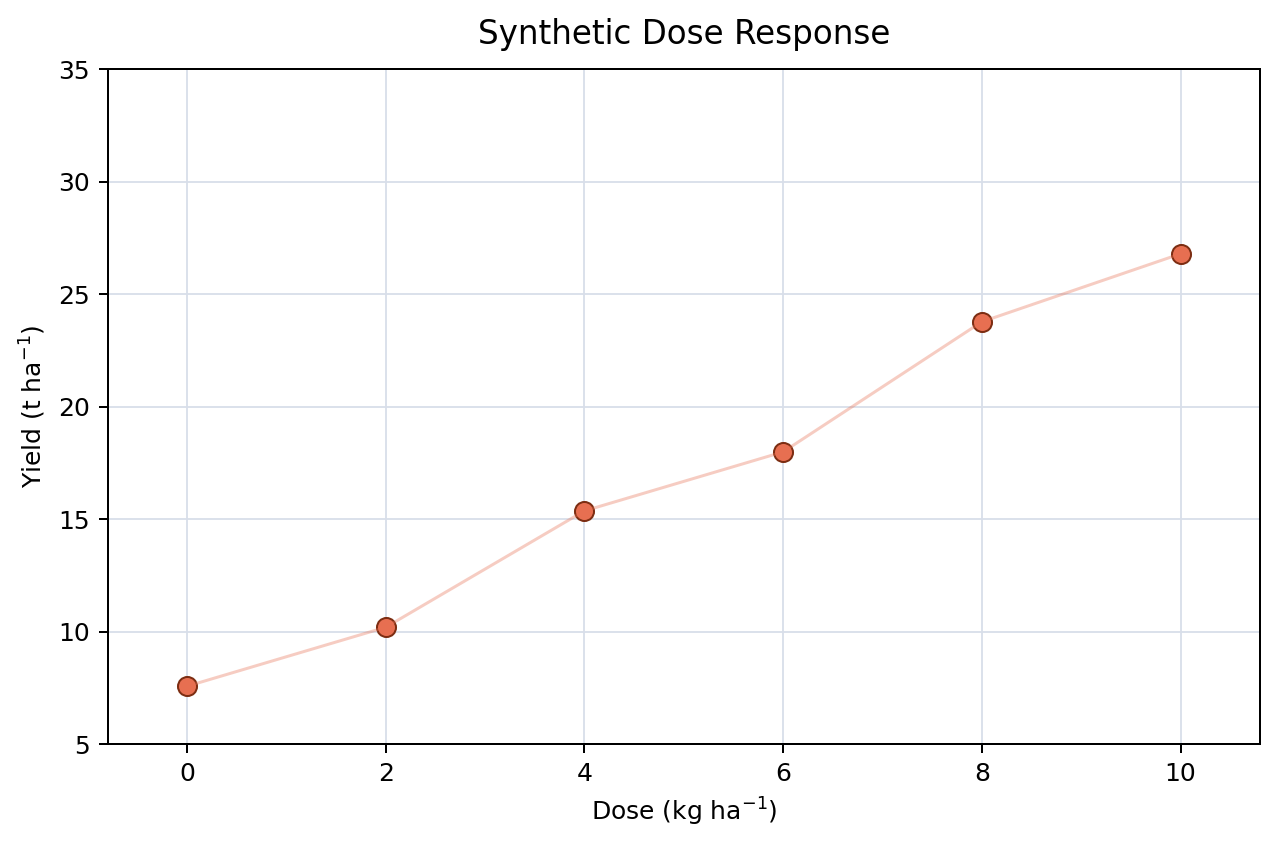
Test Chart 2 — Scatter / Line
(Synthetic Dose Response)
| Metric | Improved Quality | Standard Quality |
|---|---|---|
| Data Point Means — Bar Chart | ||
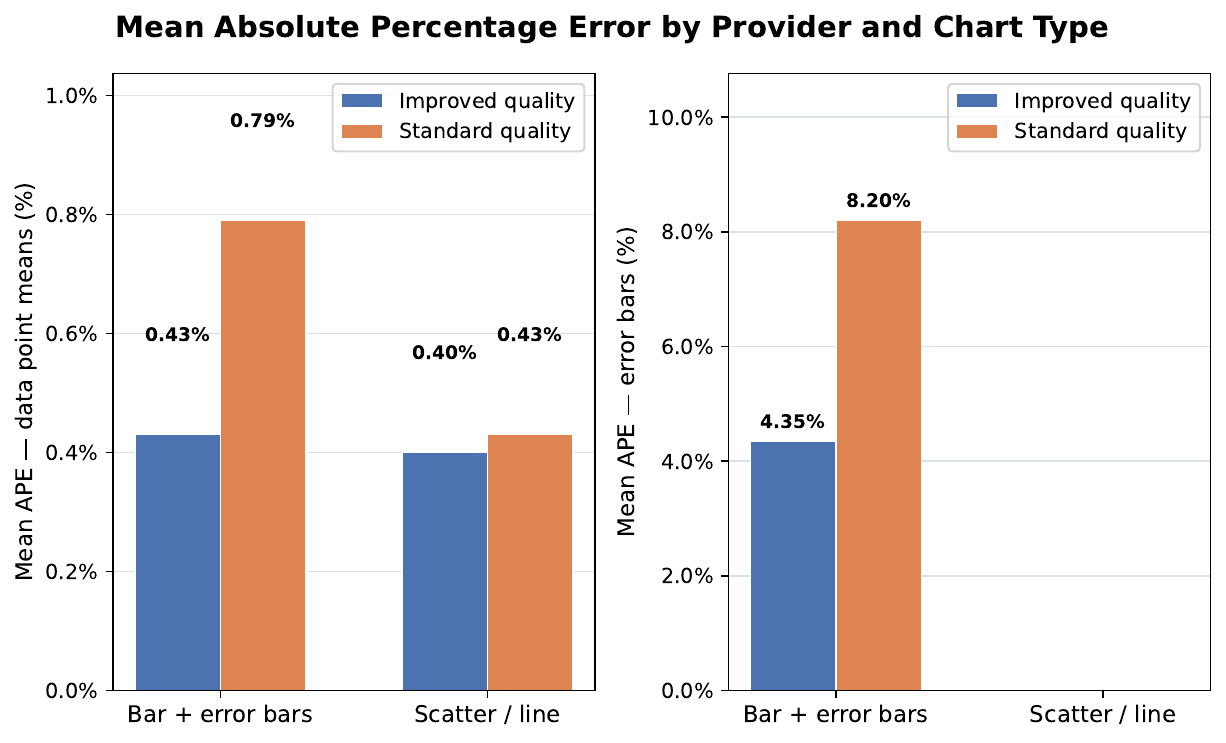
| Mean APE | 0.43% | 0.79% |
| Median APE | 0.27% | 0.55% |
| Max APE | 1.29% | 1.93% |
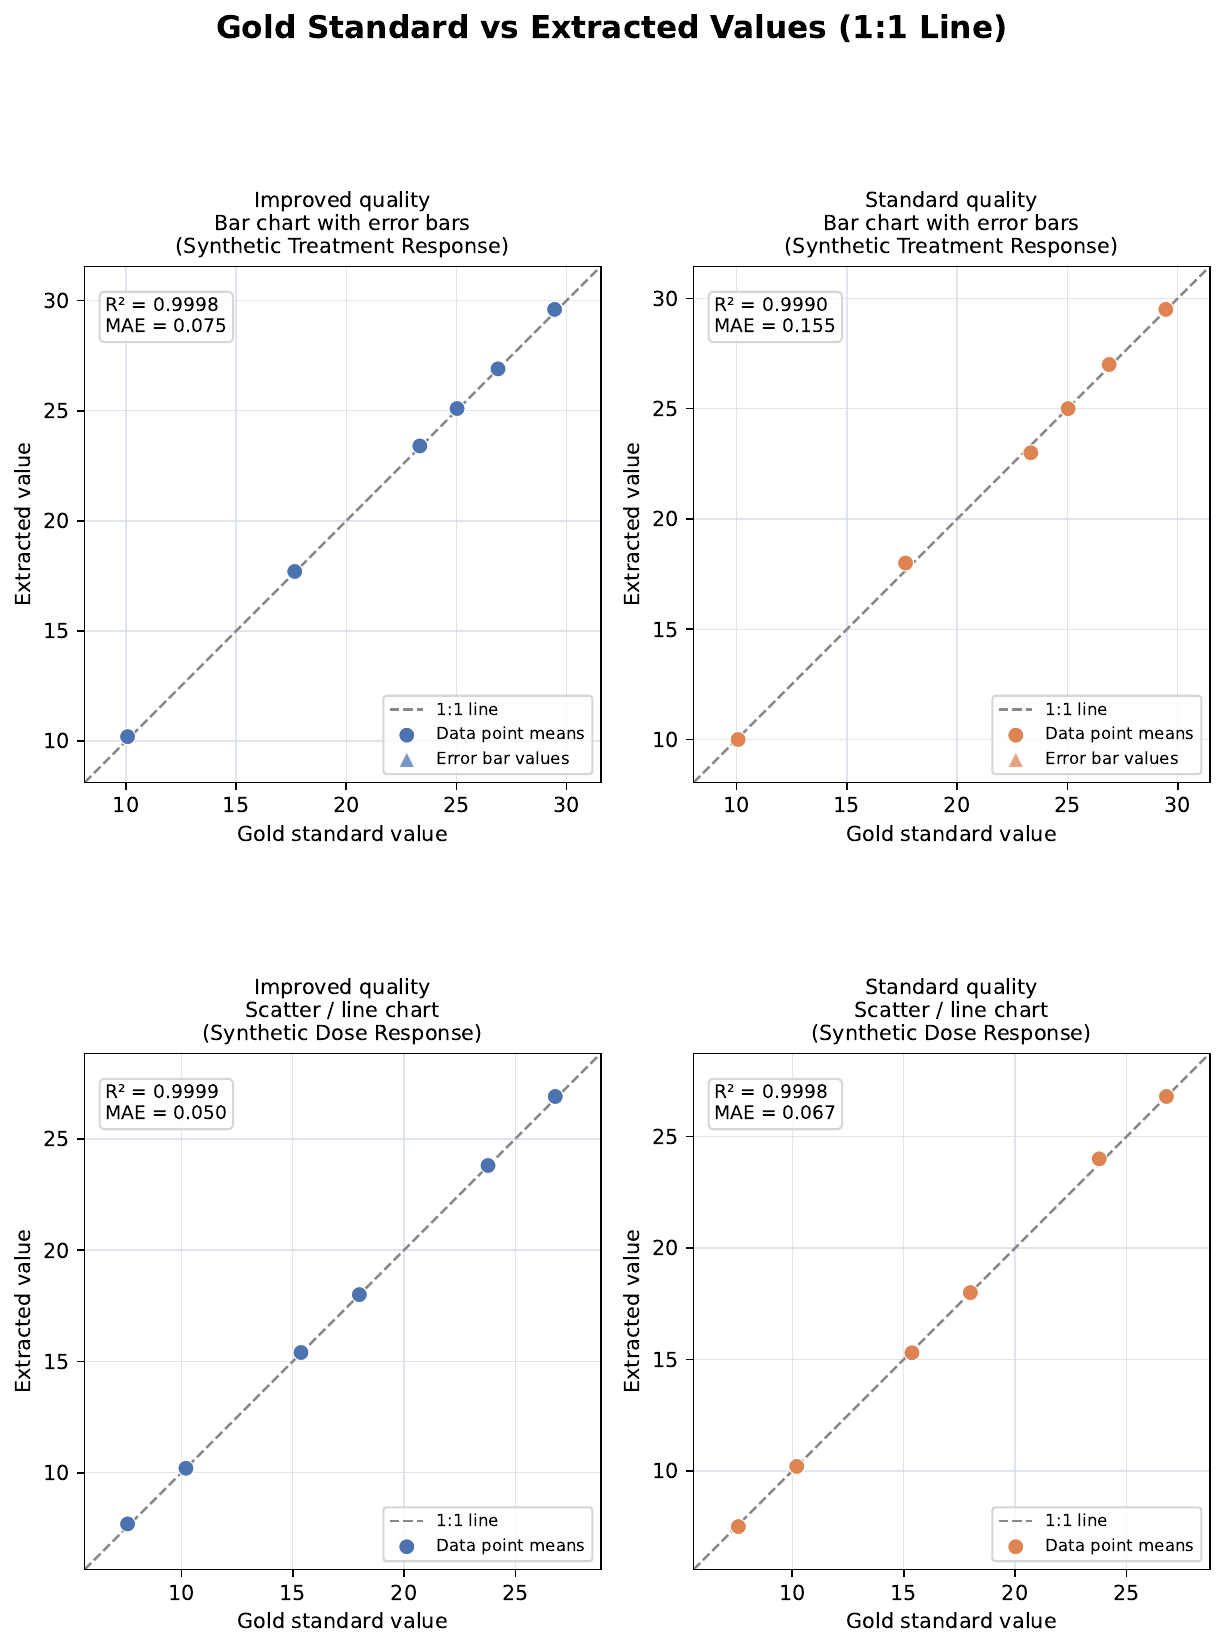
| R² (1:1 line) | 0.9998 | 0.9990 |
| MAE | 0.075 | 0.155 |
| Error Bars — Bar Chart | ||
| Mean APE | 4.35% | 8.20% (1.9× higher) |
| Median APE | 2.18% | 4.94% |
| Max APE | 11.59% | 20.00% |
| Data Point Means — Scatter / Line | ||
| Mean APE | 0.40% | 0.43% |
| Median APE | 0.16% | 0.26% |
| Max APE | 1.58% | 1.06% |
| R² (1:1 line) | 0.9999 | 0.9998 |
| MAE | 0.050 | 0.067 |
| Overall | ||
| Points matched | 6/6 both charts | 6/6 both charts |
Gold Standard vs Extracted Values (1:1 Line)
Mean APE by Quality Mode and Chart Type
Report a bug or share a suggestion. We read every message.
扫描二维码完成支付
支付完成后账户将自动更新(约 30 秒)
1 credit = $0.001 · Standard image = 3 cr · Improved image = 15 cr · PDF ≈ 20–80 cr
Buy extra credits (no expiry, consumed after monthly quota)
1 credit ≈ $0.001 · Standard Quality image = 3 credits · Improved Quality image = 15 credits